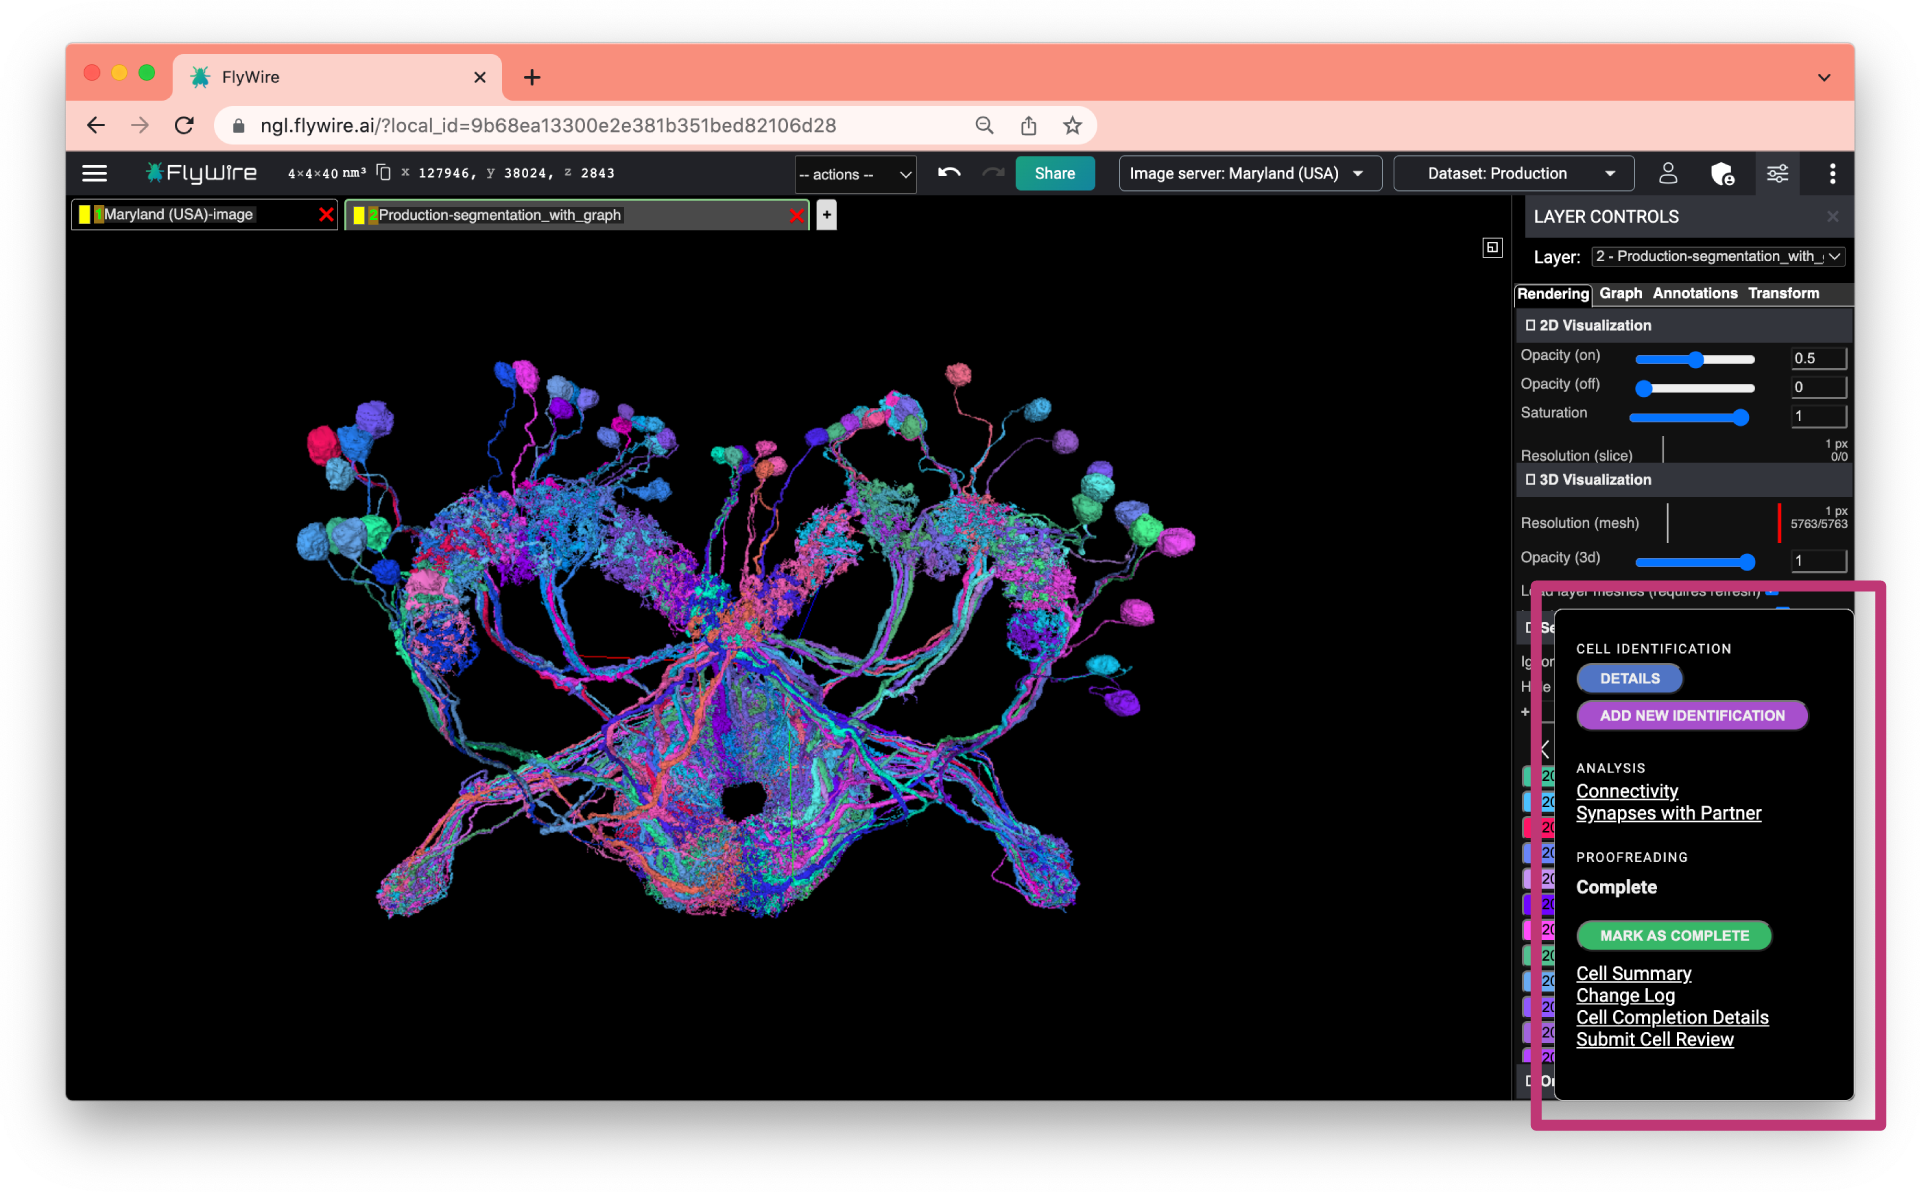

FlyWire’s Lightbulb Menu (Layer Controls –> Rendering –> Segment Selection –> Lightbulb to the right of each SegID) is home to a number of useful functions.
Lightbulb Colors
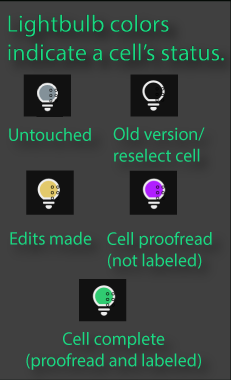
FlyWire’s lightbulb menu displays the proofreading and annotation status of every segment. It is color coded for easy reference (yellow: cell has not been declared complete; purple: complete but not labeled; green: proofread and labeled; black: out of date segmentation). Users can load cell identification directly within the FlyWire editor, perform basic connectivity analysis, and view a cell’s edit history.
Inside the Menu
Clicking a lightbulb will reveal a menu of tools that interact with a cell’s current status.
Let’s check them out. From the top!
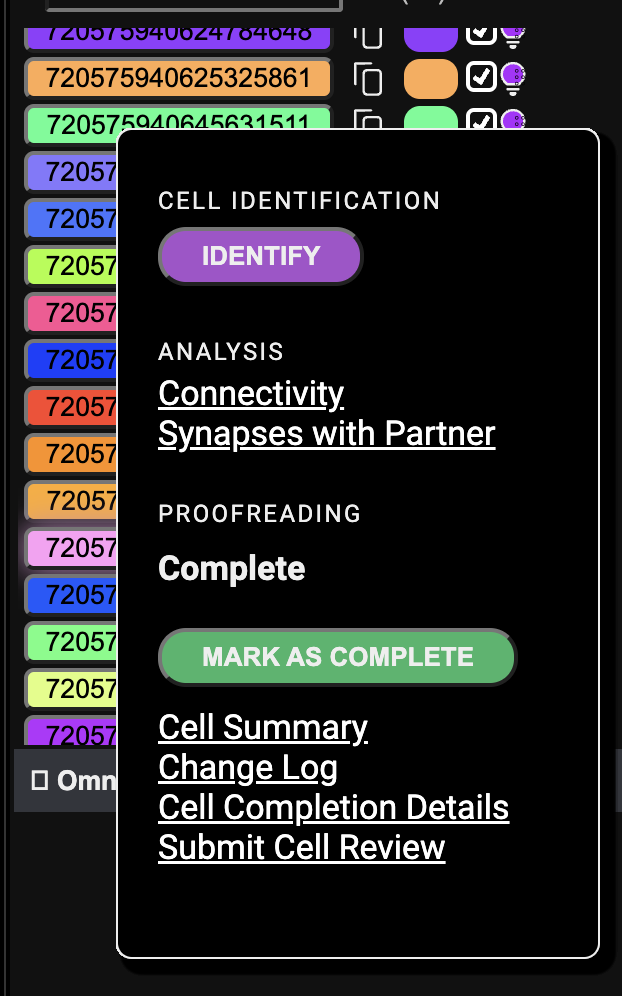
Cell Identification
Identify
Click the purple “Identify” button annotate a cell.
Any users are welcome to add Cell Identification if they feel confident in the cell type. For those working in the optic lobe we put together this reference of cell types. User profiles do not current display cell IDs but these actions are stored and will eventually make their way into the UI.
Details
The “Details” button will appear if a cell has already been labeled. If you wish to add additional labels to a cell, the “Add new identification” button allows for that as well.
Through the “Details” page you can find cell type information as well as who identified it. This tool also works as a search engine for the entire FlyWire database. Simply set filter to Cell Identification and you can find all labeled cells of any type.

Connectivity
See the presynaptic and postsynaptic partners of any number of neurons, sorted by most connected. Generate FlyWire links or download partner tables as CSVs and use those IDs to visualize in FlyWire. The Connectivity app includes neurotransmitter scores and primary input and output neuropils for selected neurons. Data can be ported to Summary and Synaptic Partner apps.
Example Connectivity App Flow
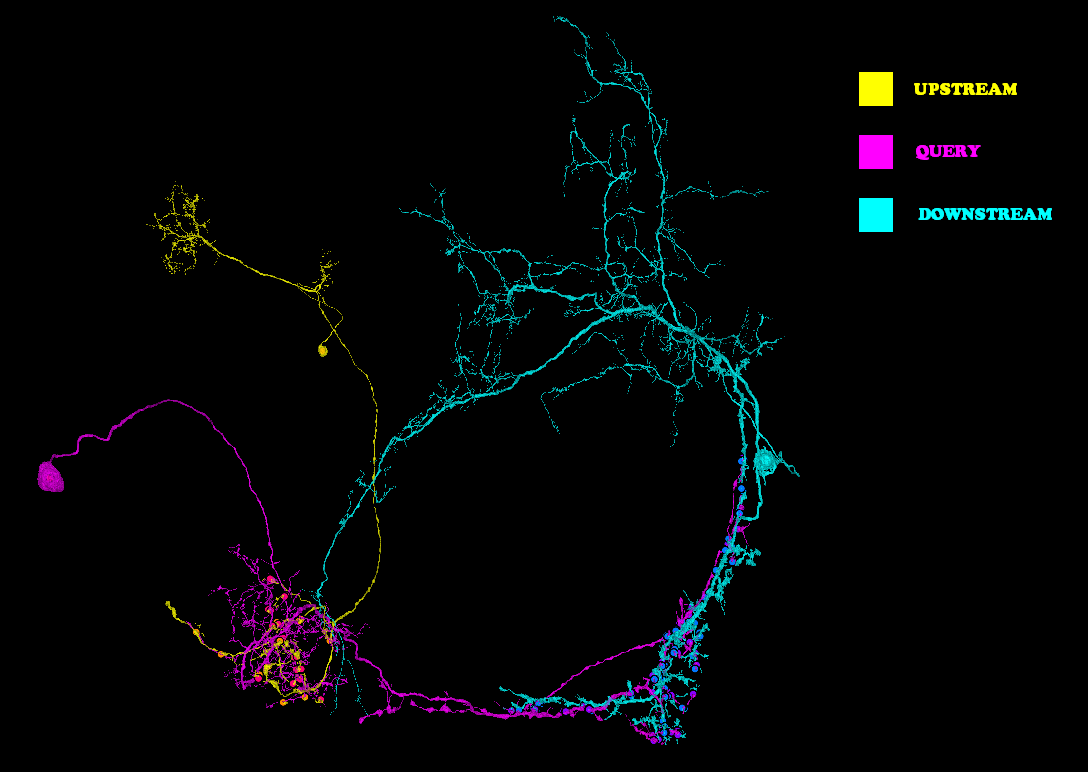
Here is an example Connectivity app output link showing all synapses of a given neuron. You can refine your search by generating links to, for example, the strongest up and downstream partners.
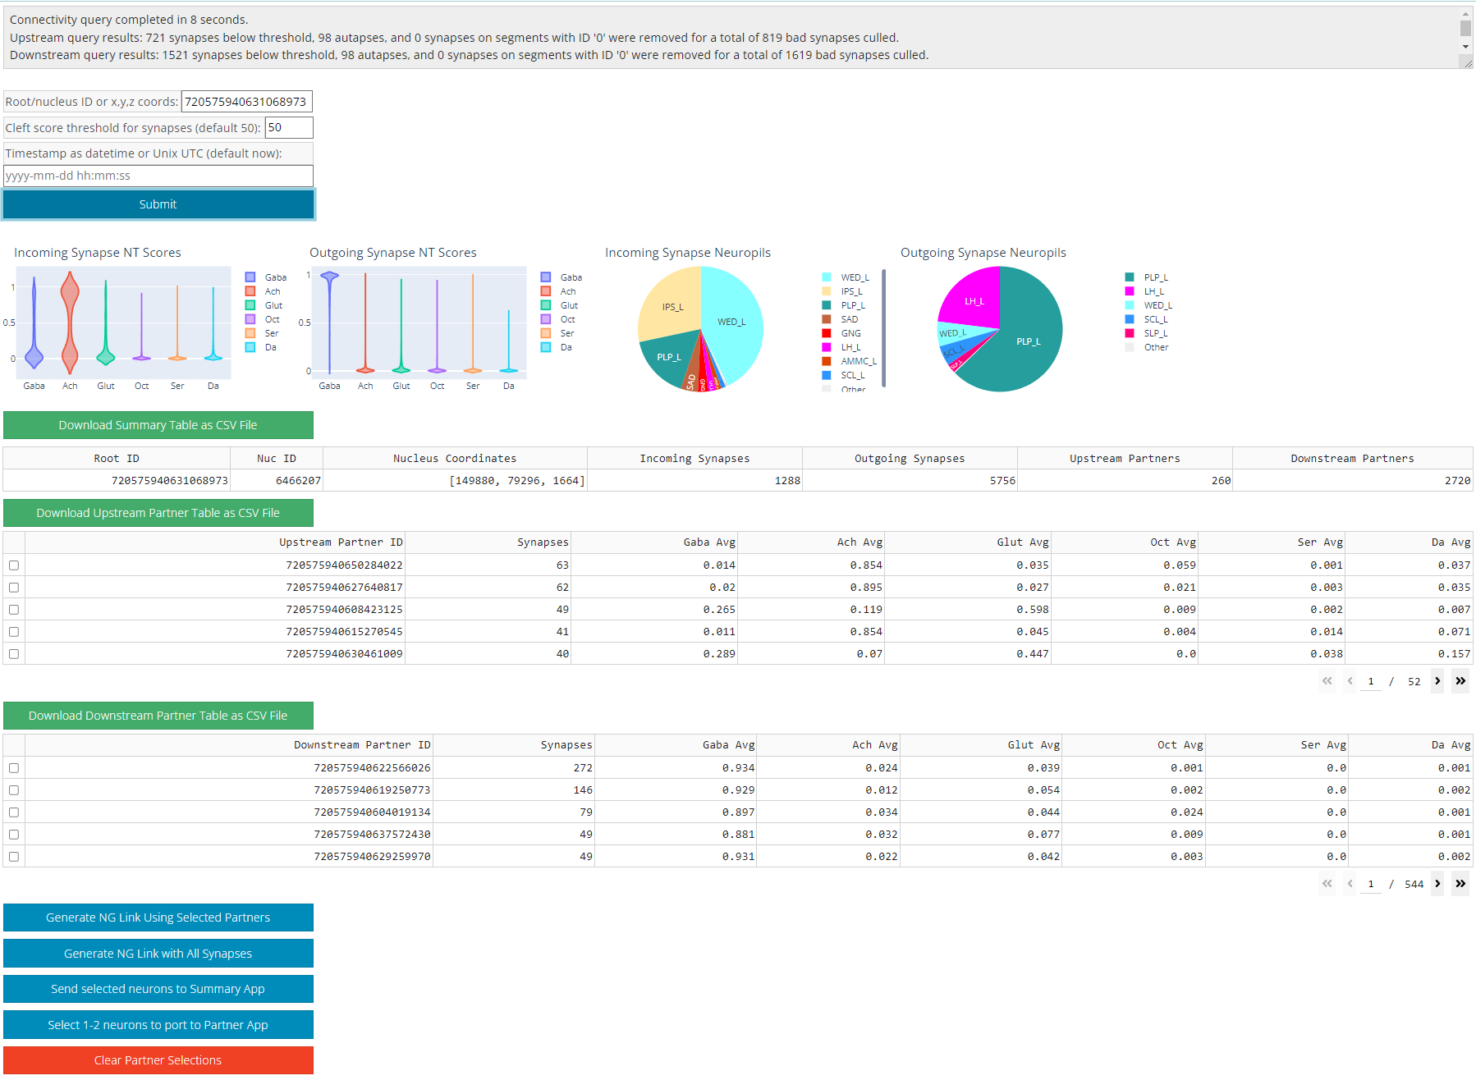
The neurotransmitter information comes from the querying the synapse table. Each synapse has scores for the likelihood that it’s tied to a given neurotransmitter (these add up to 1 for each individual synapse). For the violin plots, each violin includes all the scores from every synapse (separated by incoming/outgoing) for the neurotransmitter in question, while the partner averages take the average score of each neurotransmitter for each partner.
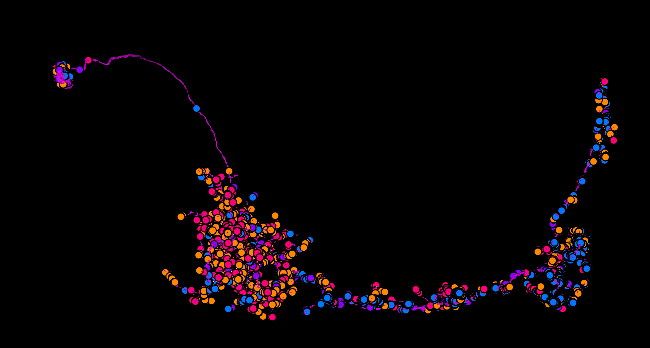
Synapses with Partner
Select any 2 neurons with connections and show their synapses as annotation points in FlyWire.
Mark Cell as Complete
When you finish proofreading a neuron, click the green button to mark it as complete.
Cell Summary
Find the history of any cell’s edits plus location and ID of nucleus via the Cell Summary. You can port your neuron of interest to the Connectivity app to analyze its partners or port any pair of neurons into the Synaptic Partner app. C
ChangeLog
See edits on a given neuron.
Cell Completion Details
Home of details relating to the completion of a neuron, including name and affiliation of proofreader.
Submit Cell Review
This tool allows users to double check that work is correct.
These features are currently in beta mode and will be expanded in the coming months. This page will be updated with new features.
One response to “A Walk Through the FlyWire Lightbulb Menu”
[…] You can find detailed information here: https://blog.flywire.ai/2022/08/10/a-walk-through-the-flywire-lightbulb-menu/ […]